Aller au contenu principal

2 articles tagués avec « observability »

Voir tous les tags

· 4 minutes de lecture
Idriss Neumann

In a previous blogpost we explained how we reduced our observability bill using Quickwit thanks to its ability to store the logs and traces using object storage:
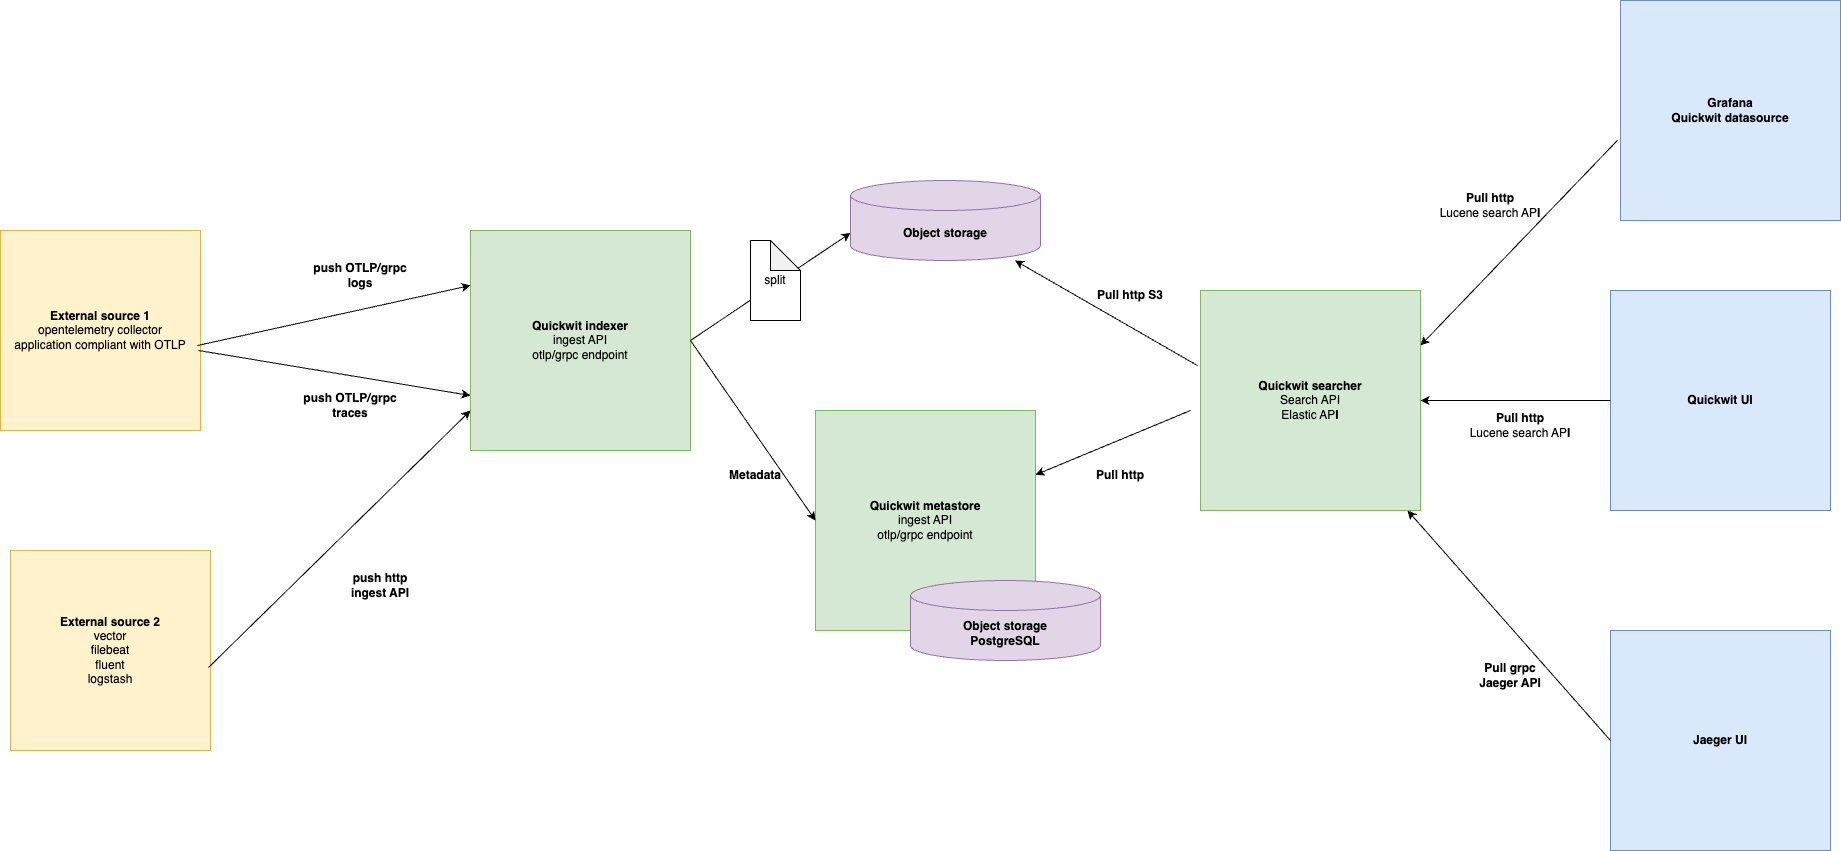
quickwit-architecture

We also said that we were using VictoriaMetrics in order to store our metrics but weren't satisfied by it lacks of object storage support.

We always wanted to store all our telemetry, including the metrics, on object storage but weren't convinced by Thanos or Mimir which still rely on Prometheus to work making them very slow.

The thing is for all of cwcloud's metrics, we're using the OpenMetrics format with a /v1/metrics endpoint like most of the modern observable applications following the state of art of observability.

Moreover, all of our relevant metrics are gauges and counter and our need is to set Grafana dashboards and alerts which looks like this:
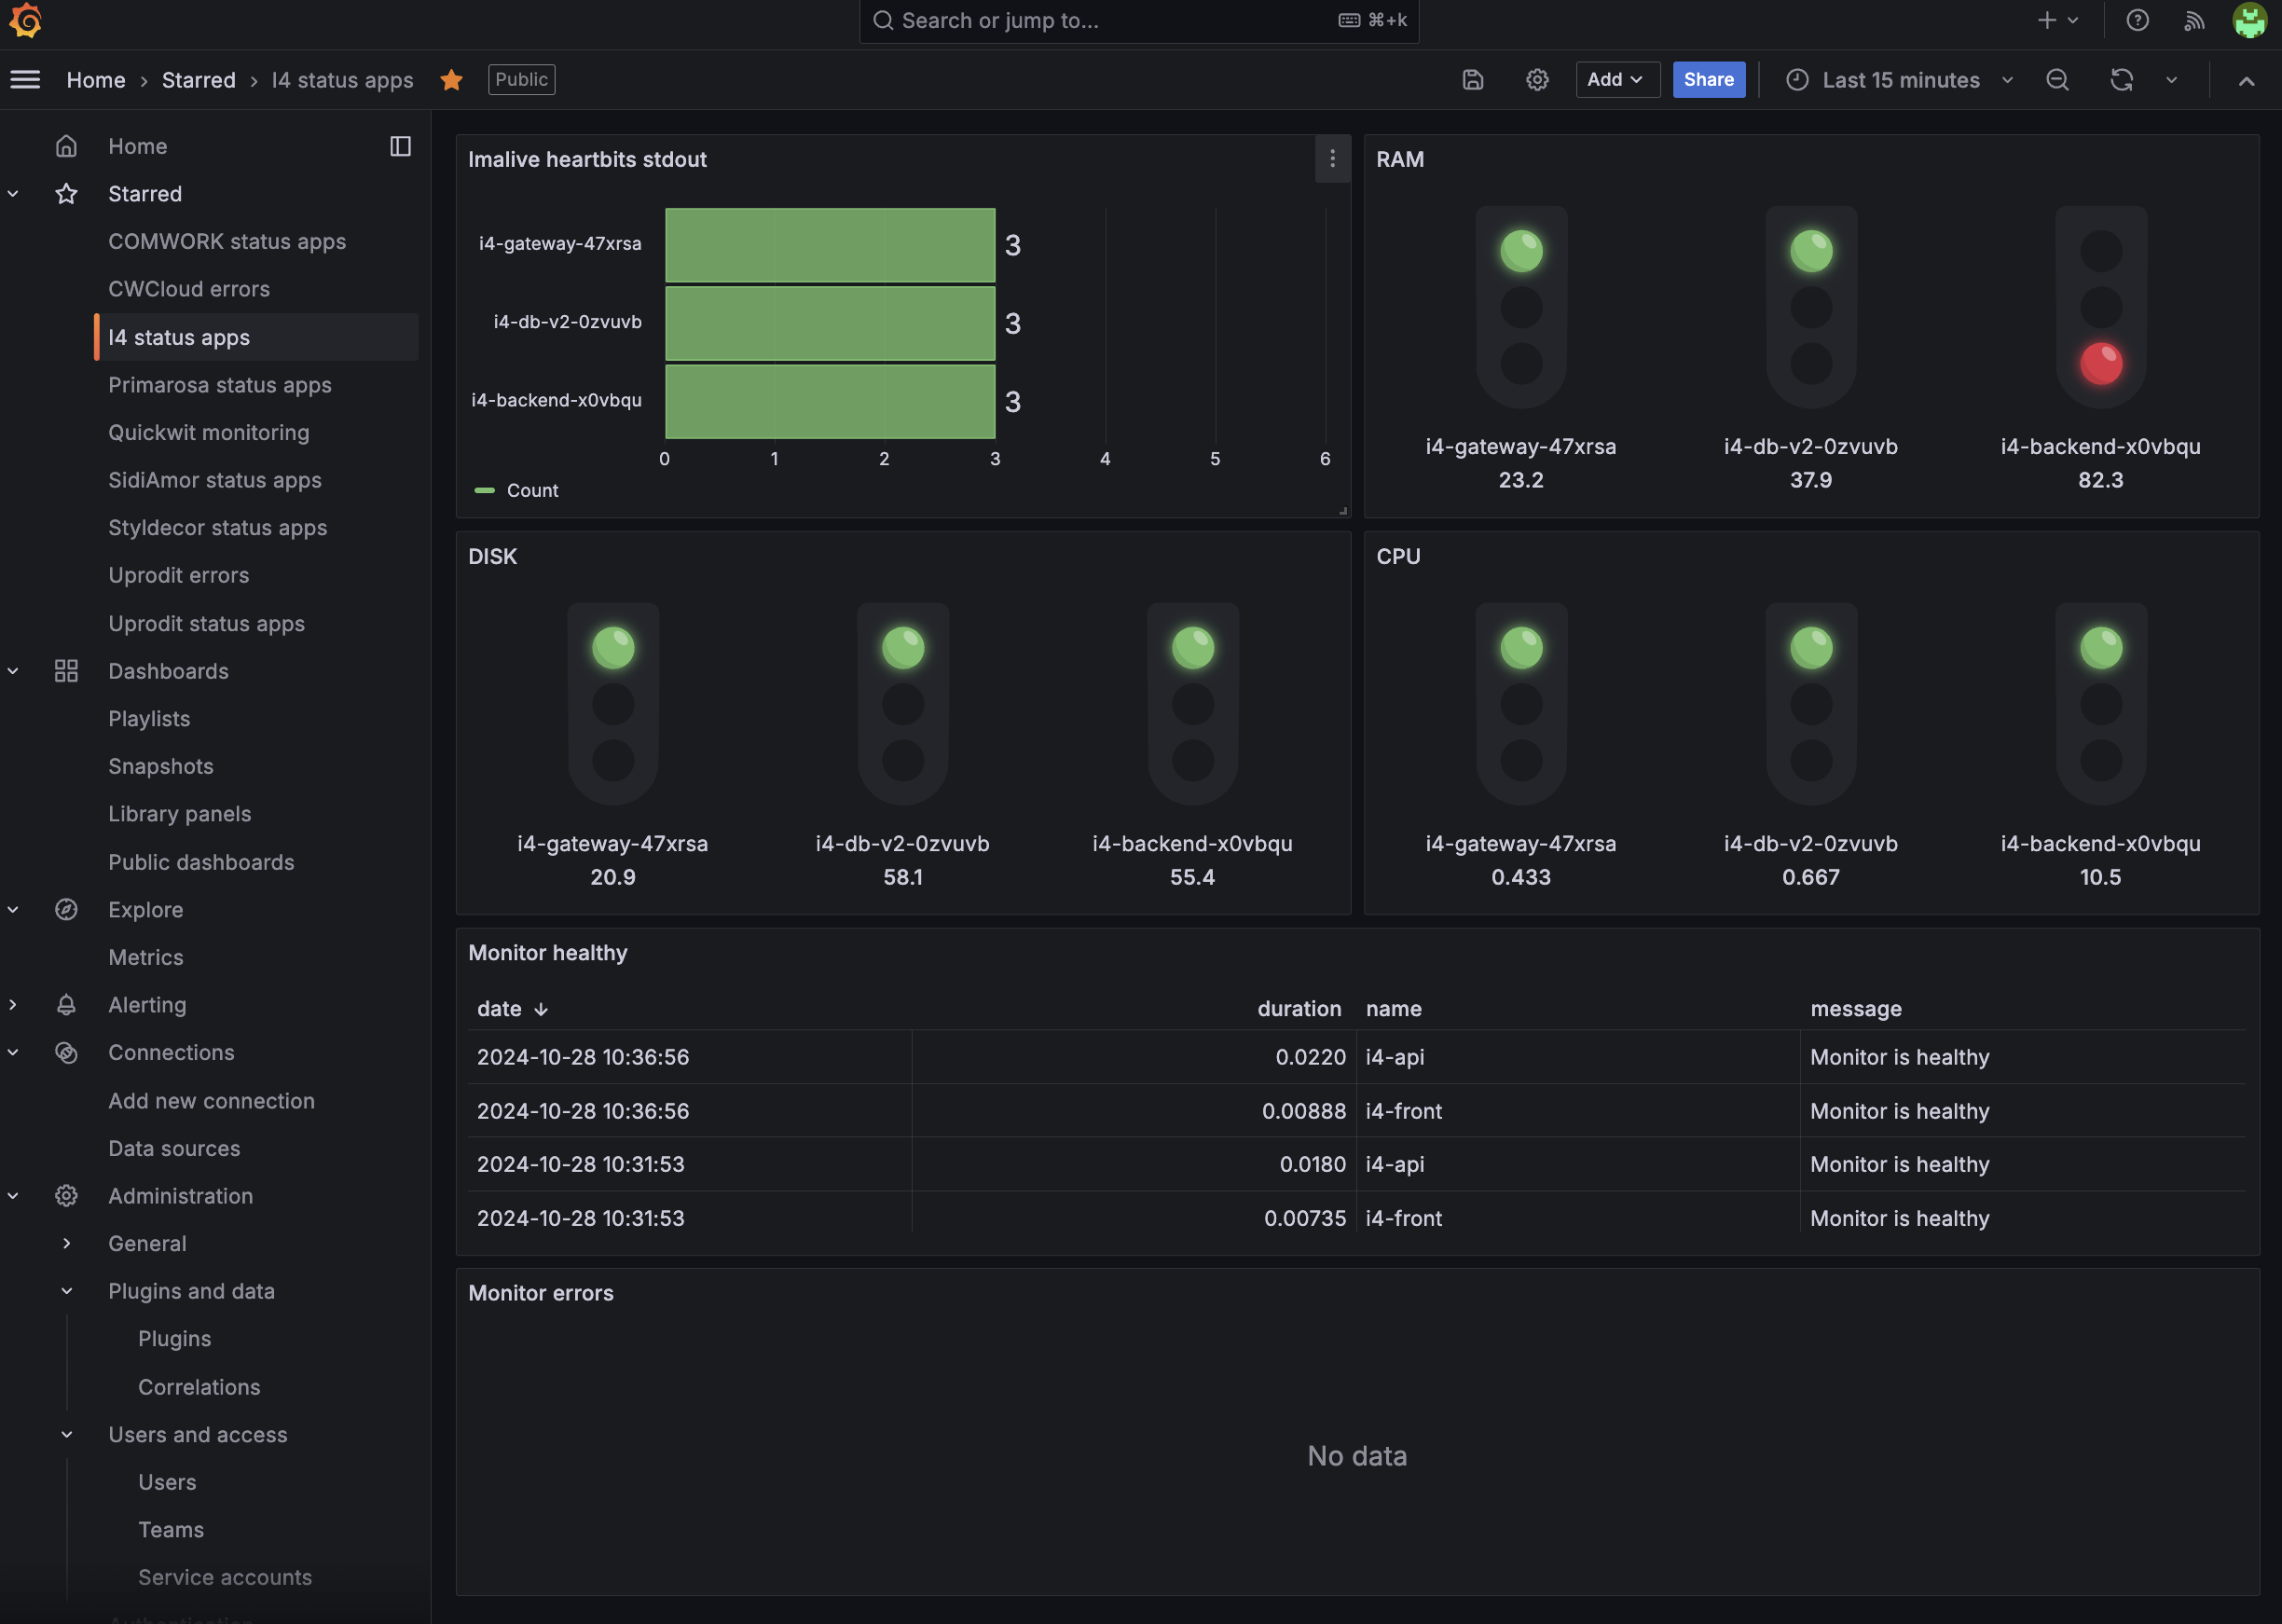
grafana-trafic-light-dashboard

In fact, we discovered that it's perfectly perfectly feasible to setup the different threshold and do some Grafana visualizations based on simple aggregations (average, sum, min/max, percentiles) using the Quickwit's datasource:
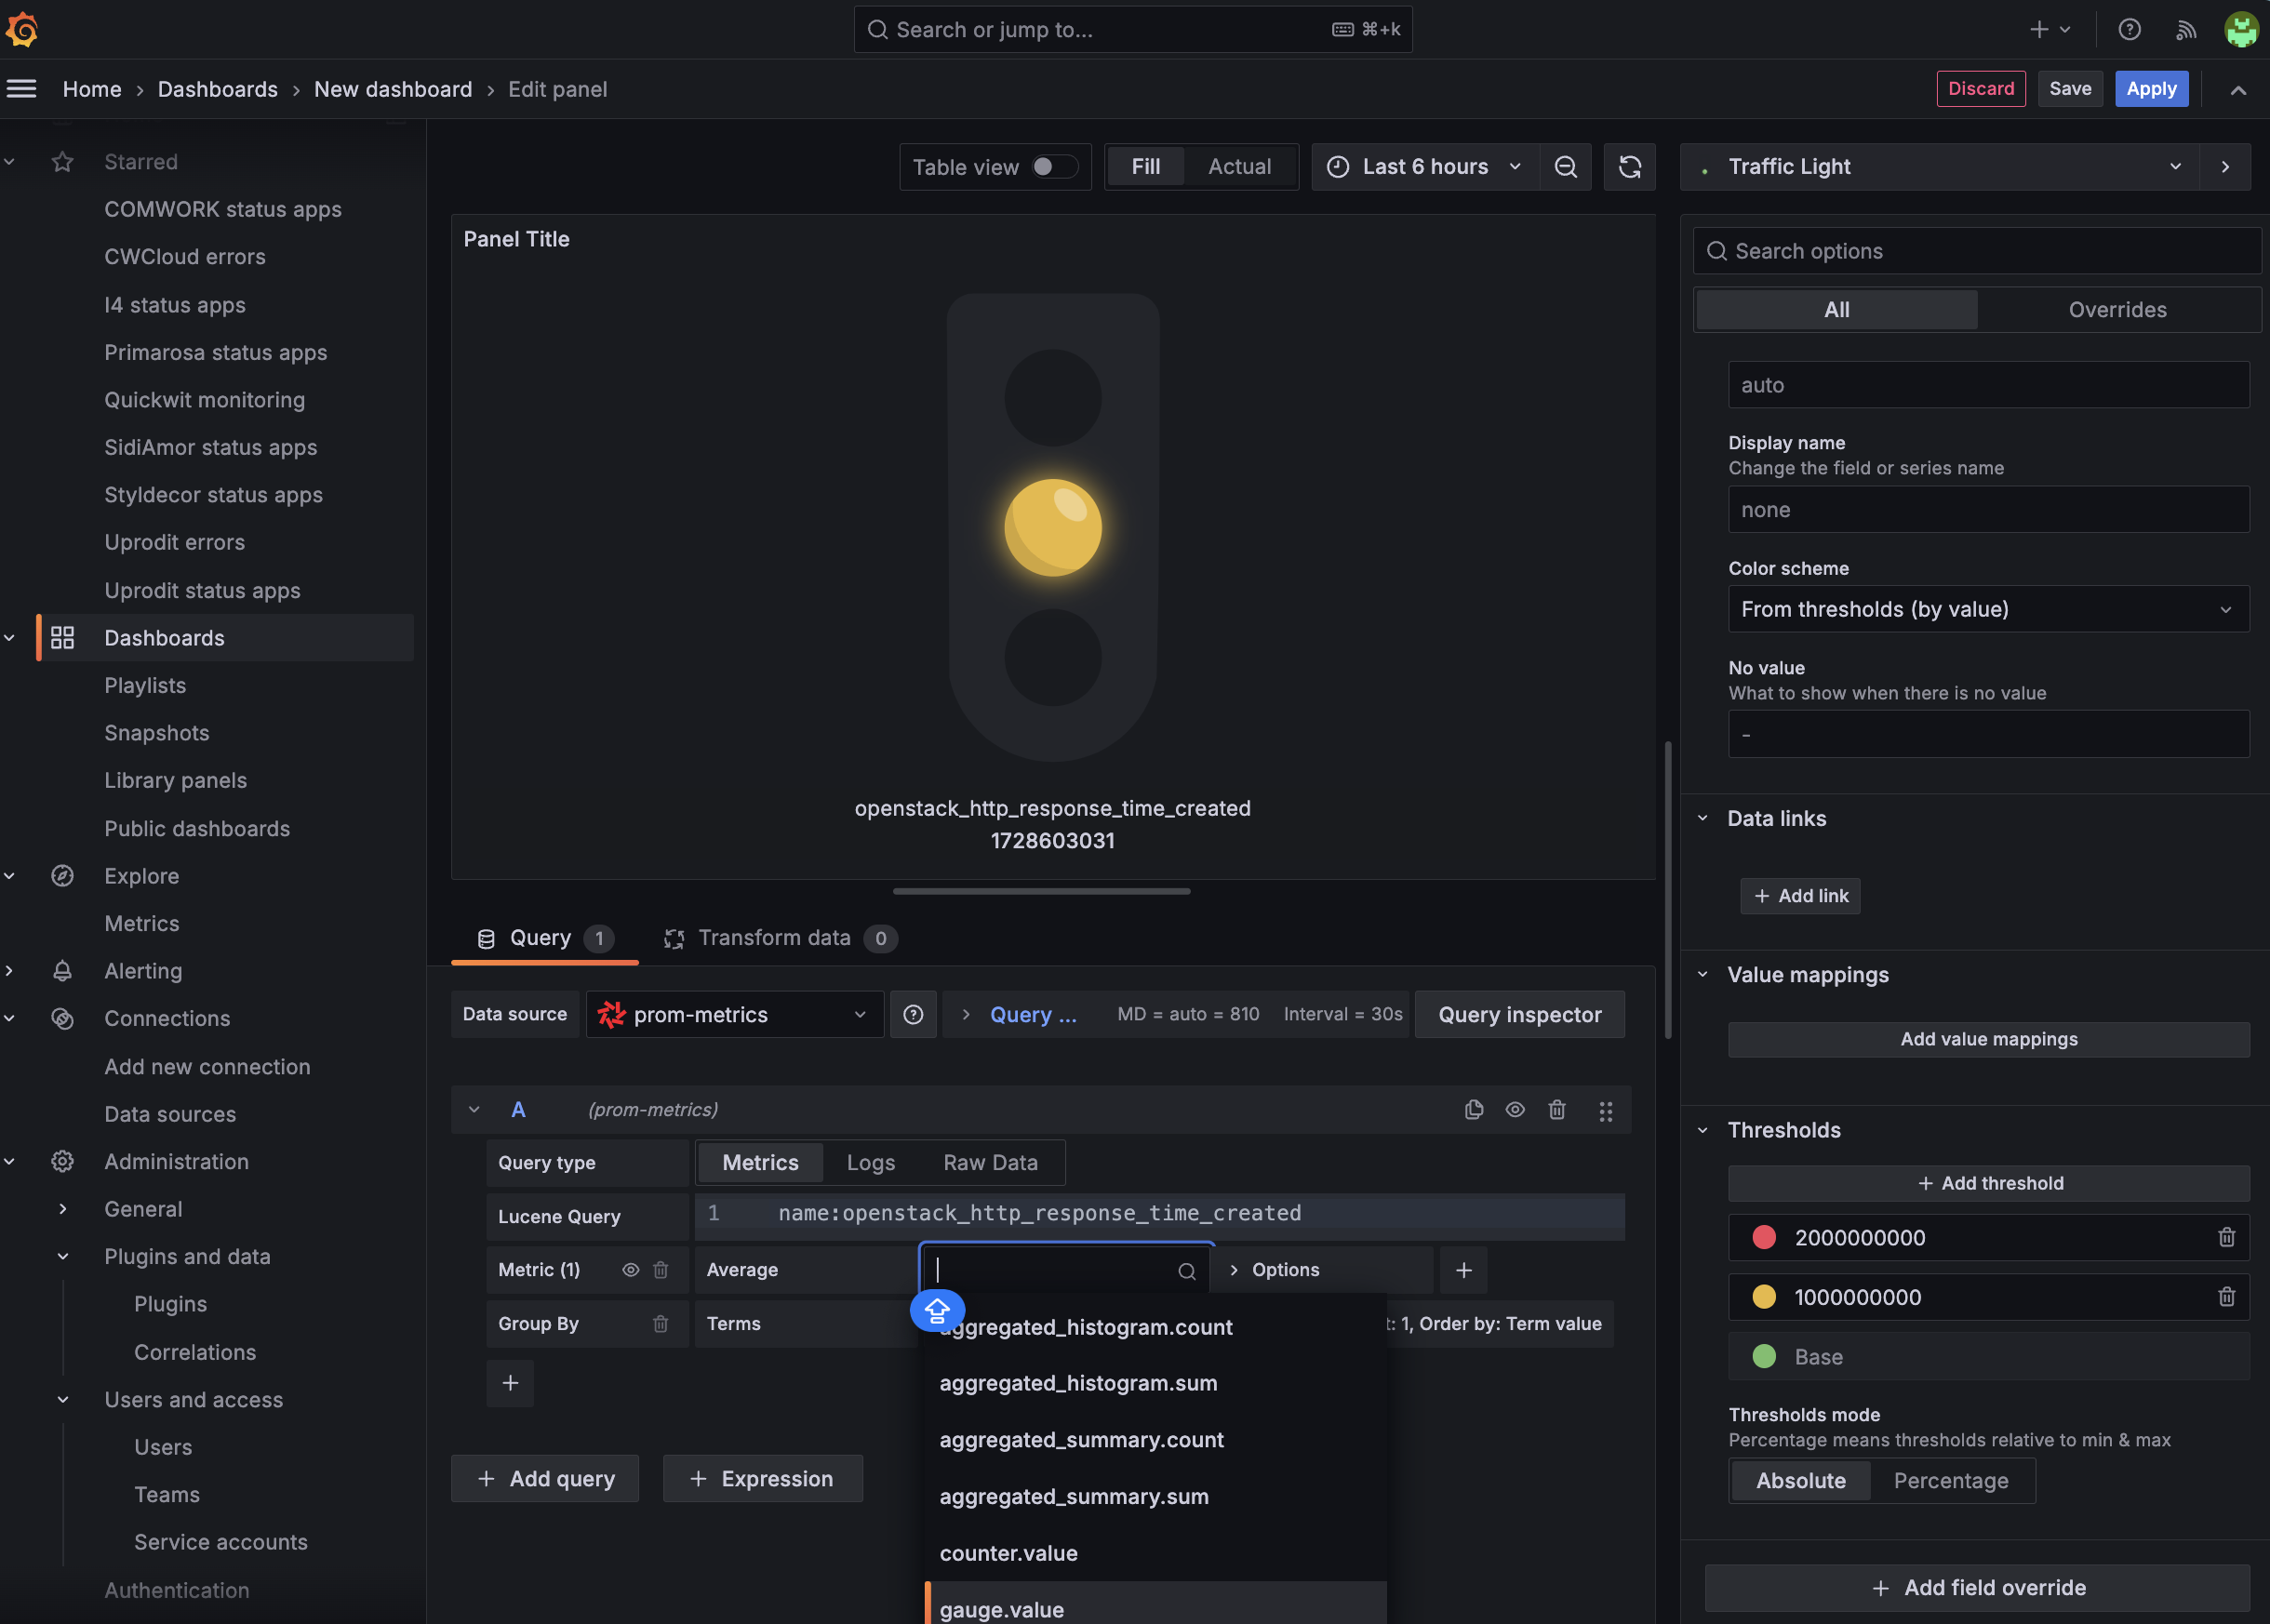
grafana-trafic-light-visualization

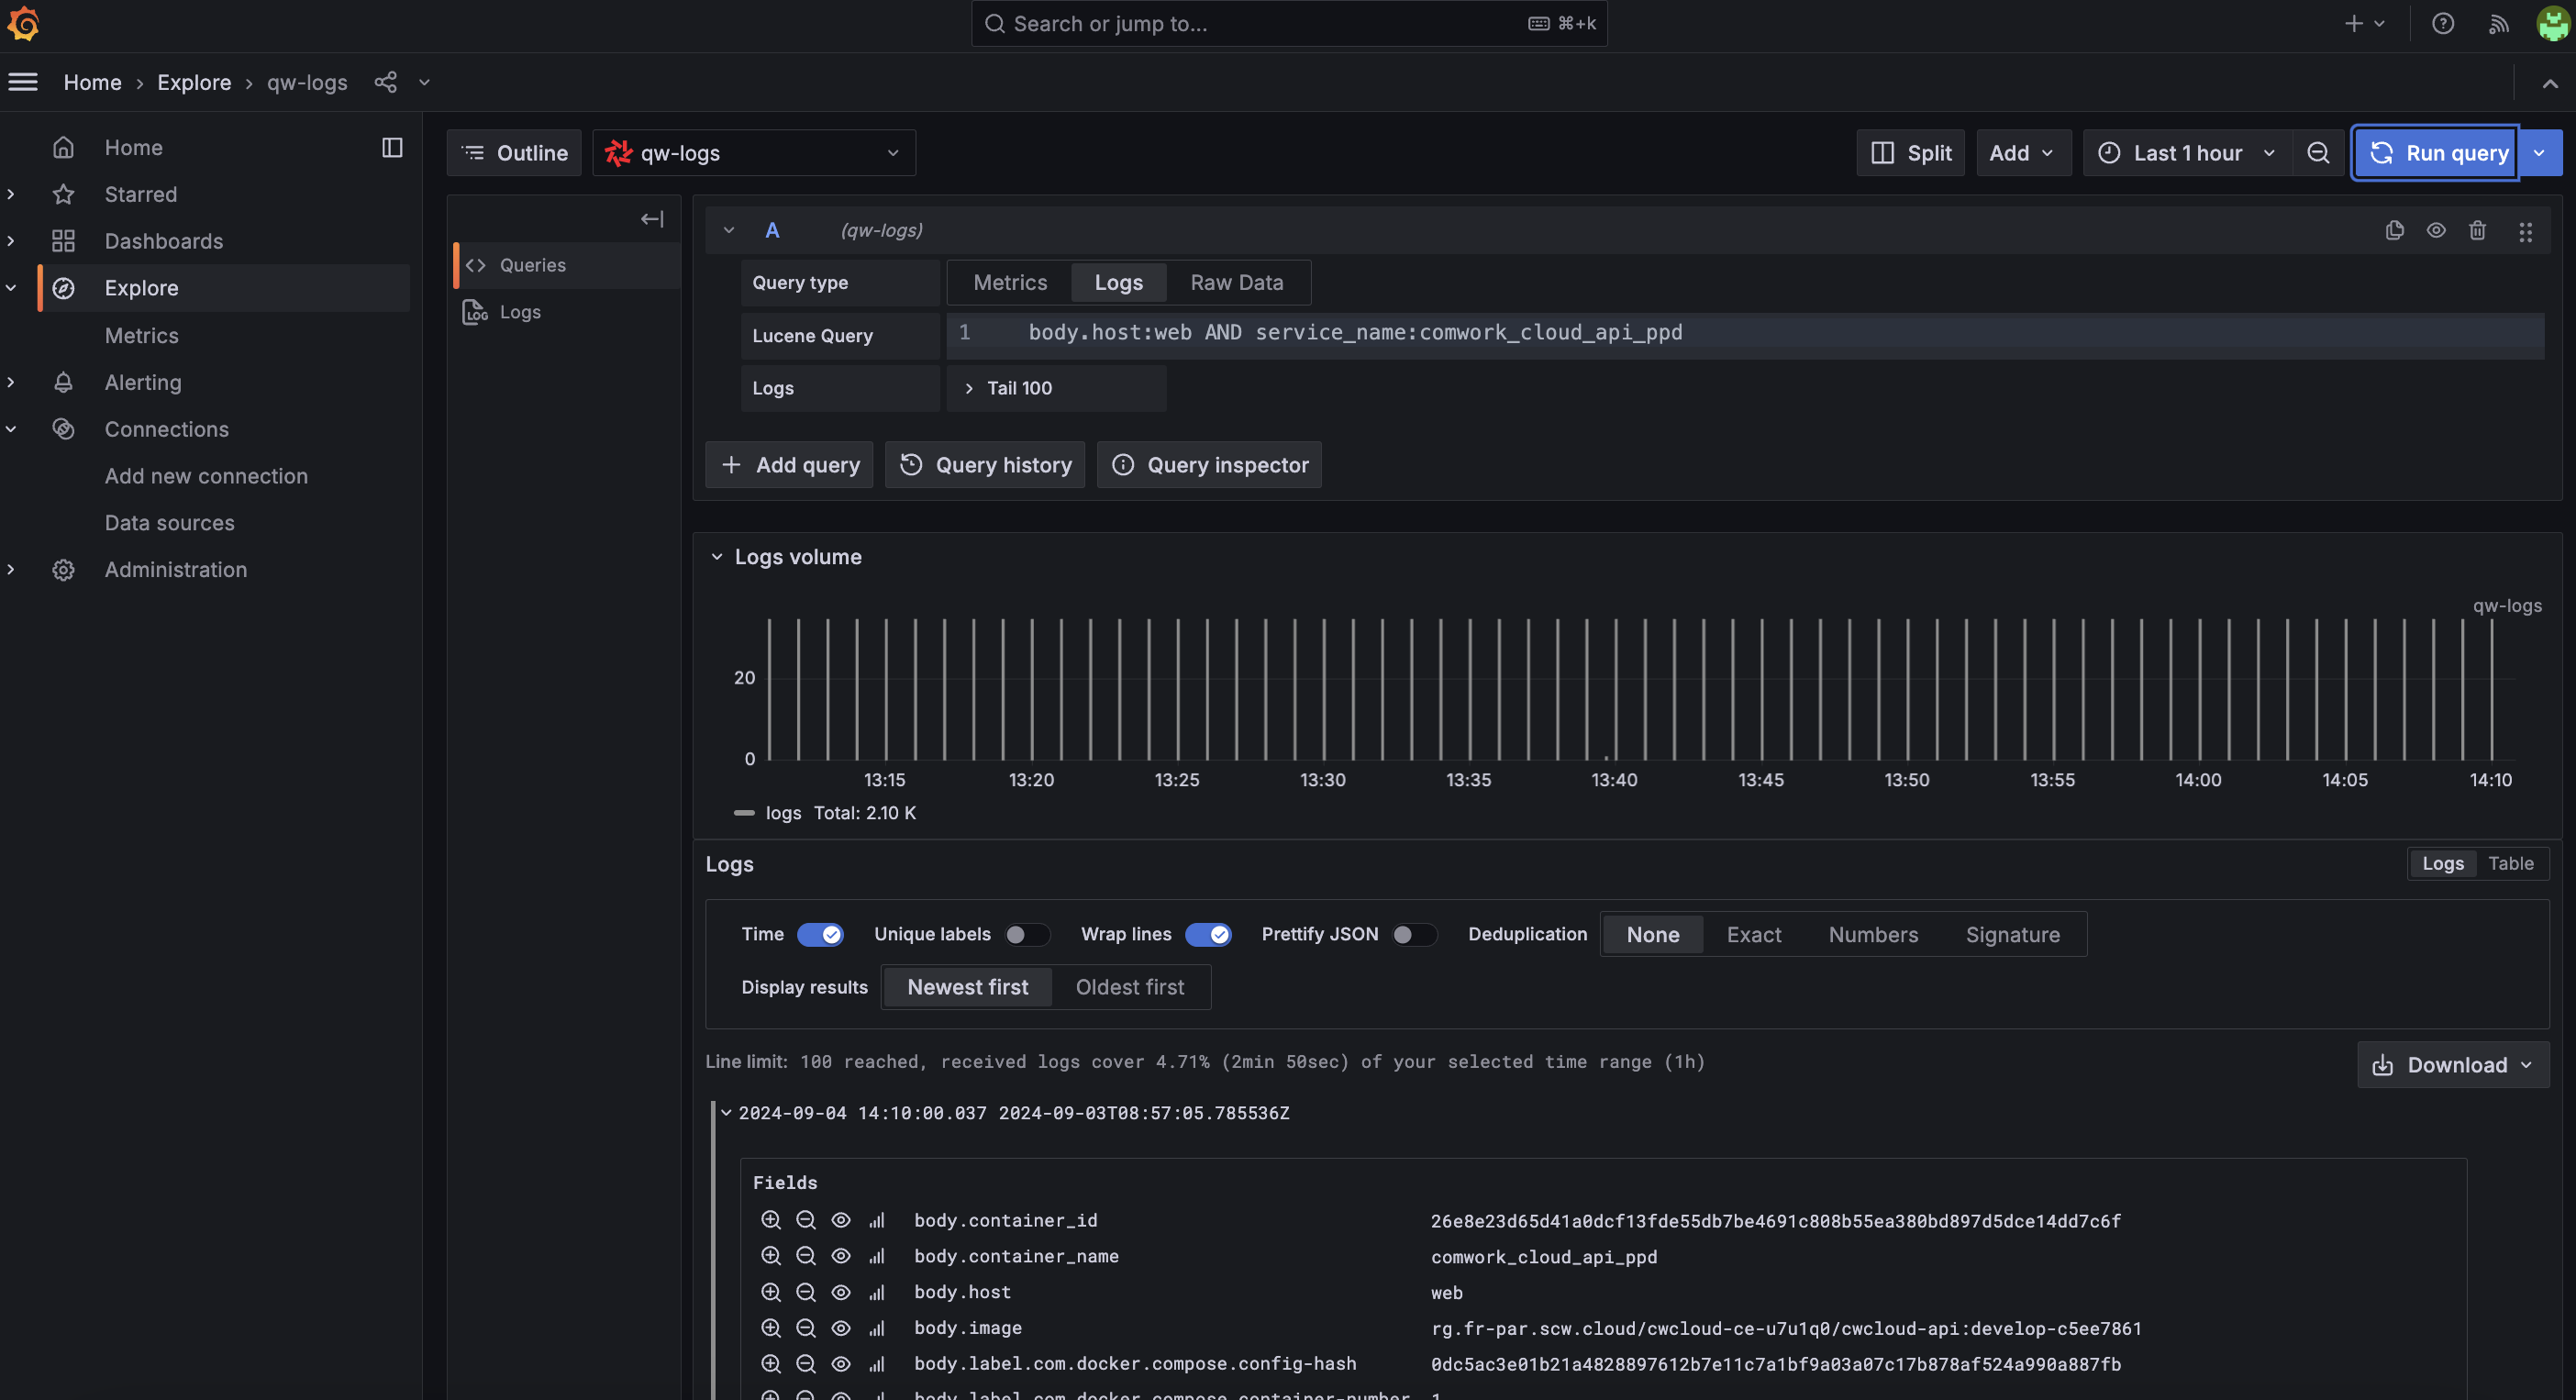
However, if you're used to also search and filter metrics using PromQL in the metrics explorer, you'll have to adapt your habits to use lucene query instead:
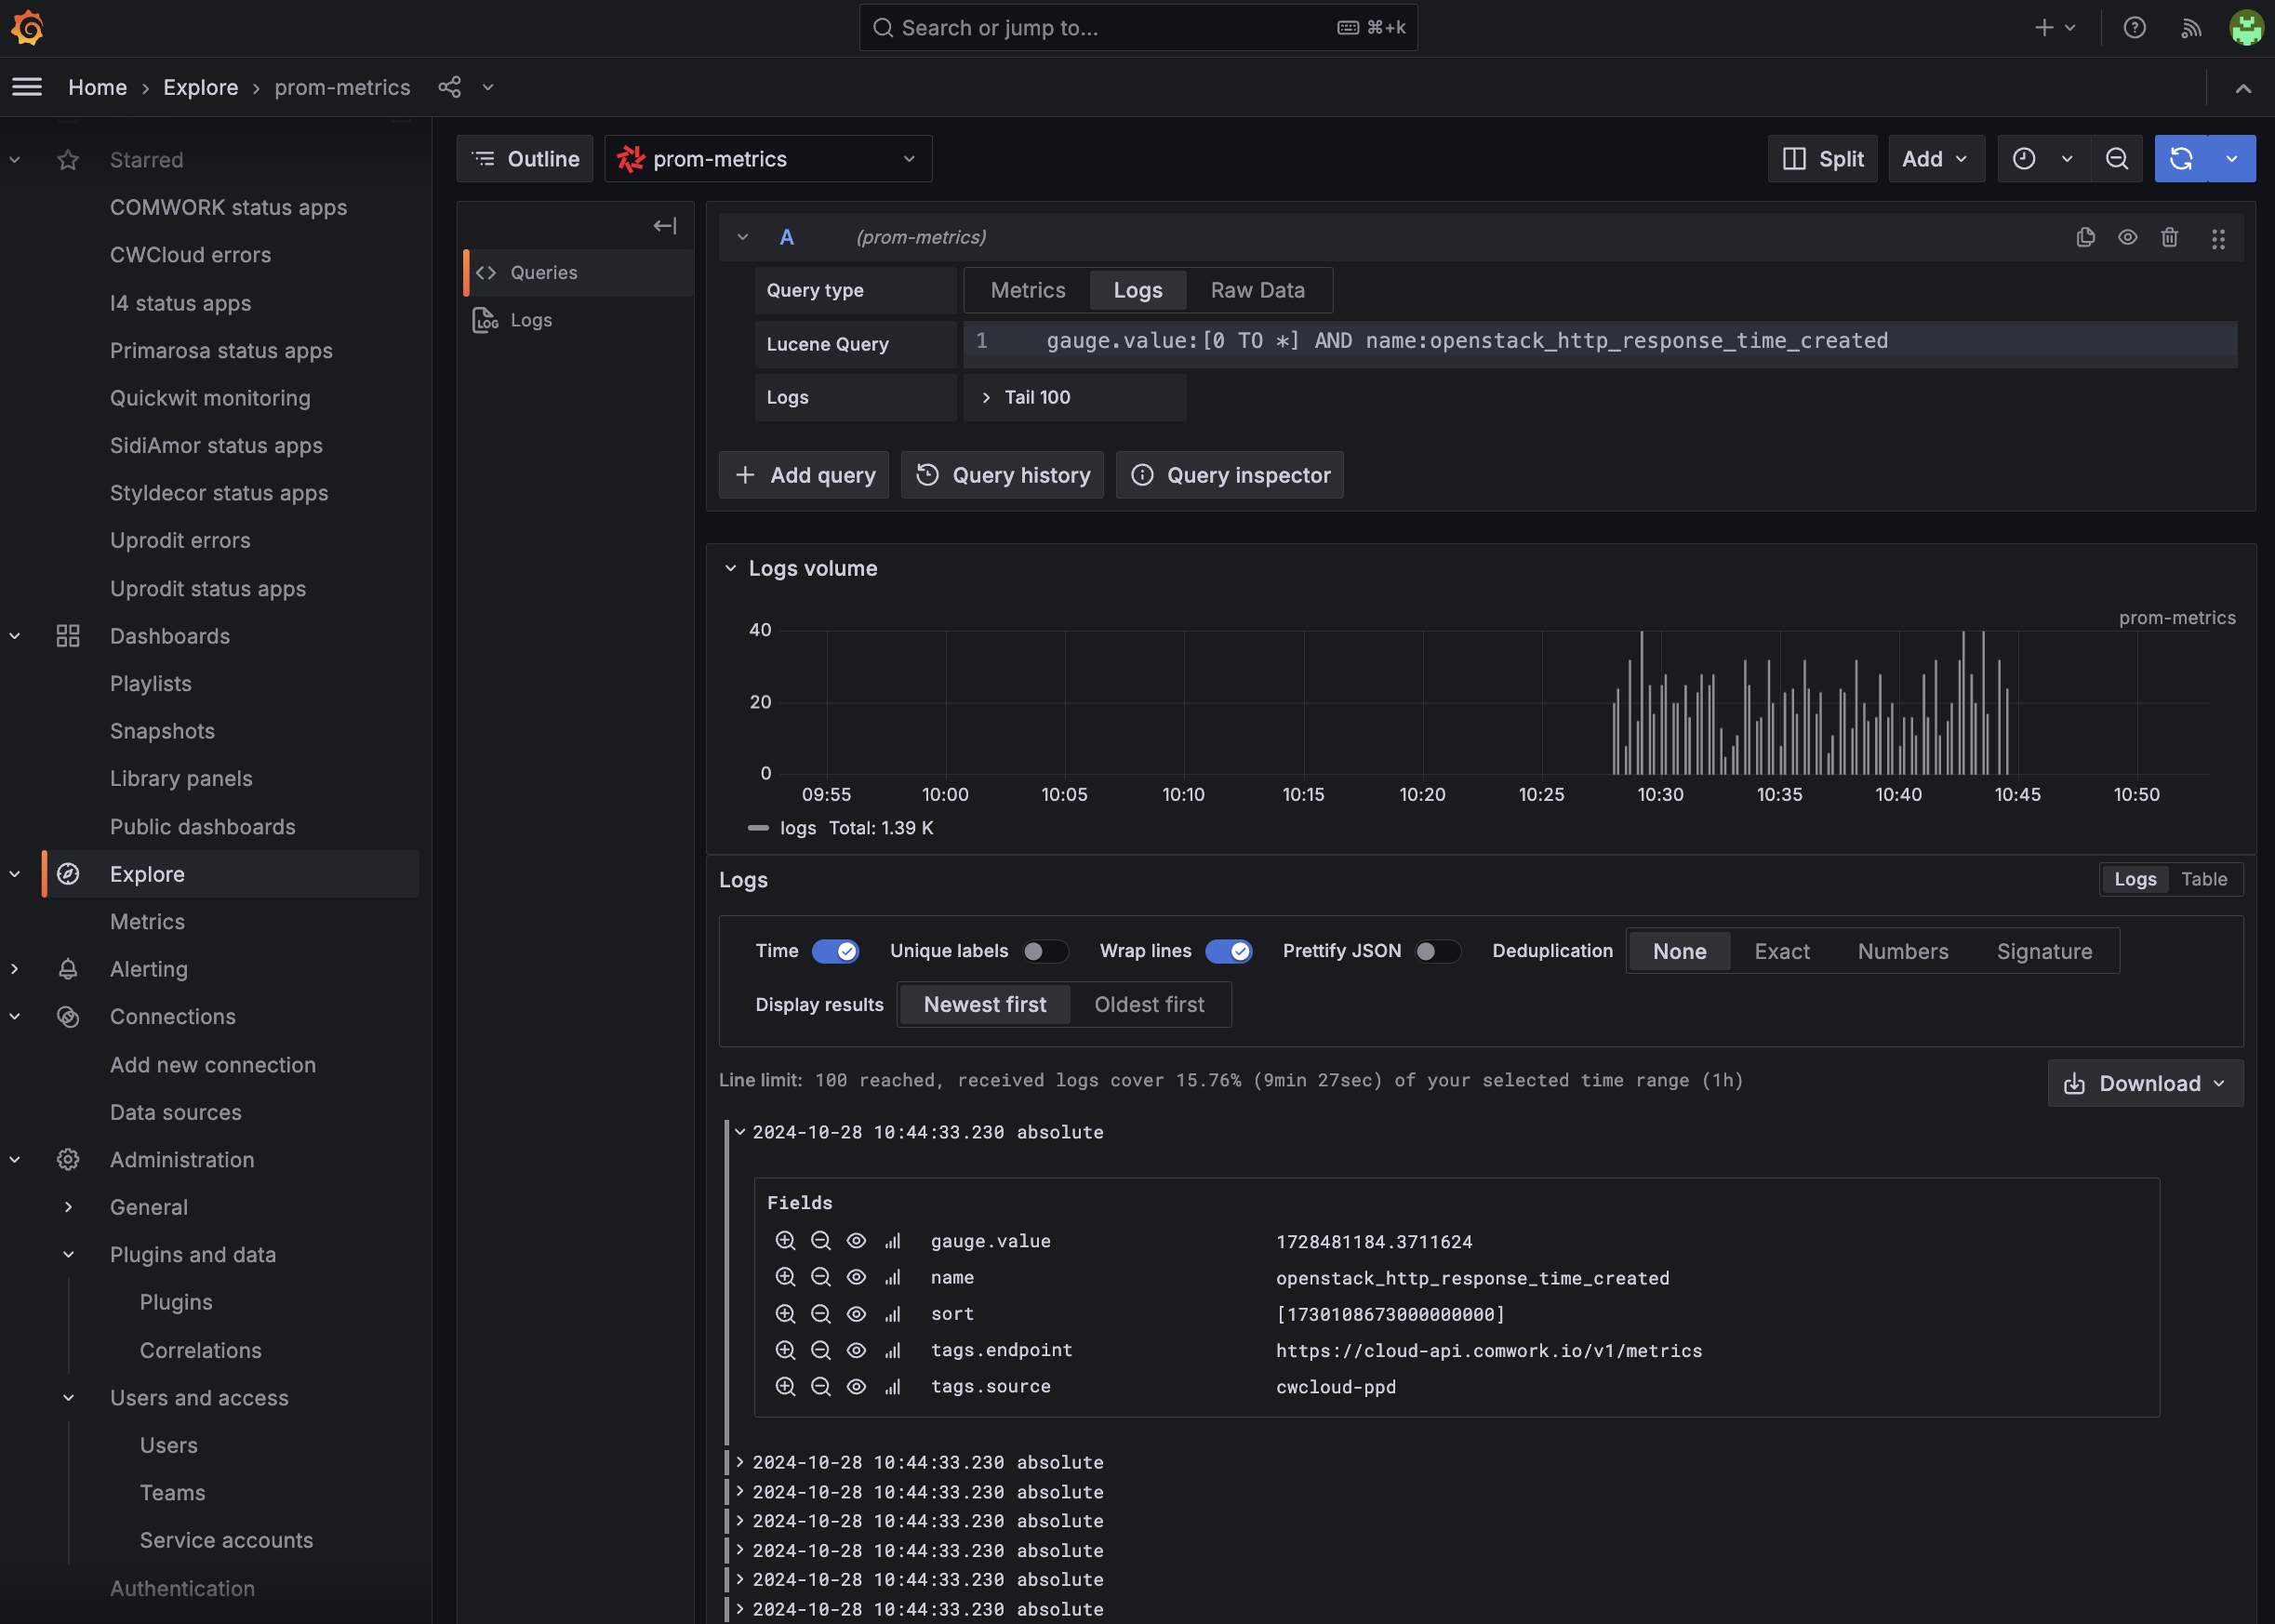
grafana-quickwit-metrics-explorer

As you can see, it's not a big deal ;-p

That been said, in order to scrap and ingest the prometheus/openmetrics http endpoints, we choosed to use vector1 with this configuration:

sources:
prom_app_1:
type: "prometheus_scrape"
endpoints:
- "https://cloud-api.comwork.io/v1/metrics"

transforms:
remap_prom_app_1:
inputs: ["prom_app_1"]
type: "remap"
source: |
if is_null(.tags) {
.tags = {}
}

.tags.source = "prom_app_1"

sinks:
quickwit_app_1:
type: "http"
method: "post"
inputs: ["remap_prom_app_1"]
encoding:
codec: "json"
framing:
method: "newline_delimited"
uri: "http://quickwit-searcher.your_ns.svc.cluster.local:7280/api/v1/prom-metrics-v0.1/ingest"

Note: you cannot transform the payload structure the way you want unlike other sources like kubernetes-logs or docker_logs sources but you can add some tags to add a bit of context. That's what we did in this example adding a source field inside the tags object.

And this is the JSON mapping to be able to match with the vector output sent to the sinks and that will make you able to make aggregations on the numeric values:

{
"doc_mapping": {
"mode": "dynamic",
"field_mappings": [
{
"name": "timestamp",
"type": "datetime",
"fast": true,
"fast_precision": "seconds",
"indexed": true,
"input_formats": [
"rfc3339",
"unix_timestamp"
],
"output_format": "unix_timestamp_nanos",
"stored": true
},
{
"indexed": true,
"fast": true,
"name": "name",
"type": "text",
"tokenizer": "raw"
},
{
"indexed": true,
"fast": true,
"name": "kind",
"type": "text",
"tokenizer": "raw"
},
{
"name": "tags",
"type": "json",
"fast": true,
"indexed": true,
"record": "basic",
"stored": true,
"tokenizer": "default"
},
{
"name": "gauge",
"type": "object",
"field_mappings": [
{
"name": "value",
"fast": true,
"indexed": true,
"type": "f64"
}
]
},
{
"name": "counter",
"type": "object",
"field_mappings": [
{
"name": "value",
"fast": true,
"indexed": true,
"type": "f64"
}
]
},
{
"name": "aggregated_summary",
"type": "object",
"field_mappings": [
{
"name": "sum",
"fast": true,
"indexed": true,
"type": "f64"
},
{
"name": "count",
"fast": true,
"indexed": true,
"type": "u64"
}
]
},
{
"name": "aggregated_histogram",
"type": "object",
"field_mappings": [
{
"name": "sum",
"fast": true,
"indexed": true,
"type": "f64"
},
{
"name": "count",
"fast": true,
"indexed": true,
"type": "u64"
}
]
}
],
"timestamp_field": "timestamp",
"max_num_partitions": 200,
"index_field_presence": true,
"store_source": false,
"tokenizers": []
},
"index_id": "prom-metrics-v0.1",
"search_settings": {
"default_search_fields": [
"name",
"kind"
]
},
"version": "0.8"
}

To conclude, despite the fact that Quickwit isn't a real TSDB2 (time-series database), we found it pretty easy with vector to still use it as a metrics backend with vector. And this way we still can say to our developer to rely on the OpenMetrics/Prometheus SDK to expose their metrics routes to scrap. However we're still encouraging some of our customer to use VictoriaMetrics because it's still experimental and some of them need more sophisticated computation capabilities3.

One of the improvements that we immediatly think about, would be to also implement the OpenTelemetry compatibility in order to be able to push metrics through OTLP/grpc protocol. We opened an issue to the quickwit's team to submit this idea but we think that it can be also done using vector as well.


  1. to get more details on the prometheus_scrape input, you can rely on this documentation
  2. at the time of writing, because we know that Quickwit's team plan to provide a real TSDB engine at some point
  3. for example, using multiple metrics in one PromQL query, using the range functions such as rate or irate...

· 6 minutes de lecture
Idriss Neumann

In this blog post, I'll try to explain why we moved from ElasticStack to Quickwit and Grafana and why we choosed it over other solutions.

First, we've been in the observability world for quite some time and have been using ElasticStack for years. I personally used Elasticsearch for more than 10 years and Apache SolR before for logging and observability usecases even before Elasticsearch's birth!

We also succeed to use ElasticStack for IoT (Internet of Things) projects and rebuilt our own images of Kibana and Elasticsearch for ARM32 and ARM64 before Elastic (the company) starts to release official images. We had a lot of fun with it.

rpi-elastic

However everyone who works with it on premises know that Elastic is a big distributed system which brings everyone lot of struggles such as:

  • The log retentions because it's on filesystem and storage on disk is expensive1
  • Like most of highly distributed databases developed in Java, it has a very high footprint, consumes a lot of RAM...
  • You have also some issue such as "split brains" when you're dealing with HA (High Availability)

On the other hand, there's SaaS (Software as a Service) observability solutions such as Datadog or Elastic cloud which are saving you the trouble of managing clusters but which are very expansive. And even putting the price aside, most of our customers are required to keep all the data on an infrastructure they own.

That been said, Grafana proposed an alternative which is called Grafana Loki which is storing the data on object storage. The idea of using object storage is great because it's often implementing HA by design on most of the big cloud players and it lower the price a lot. Moreover, even when you're on premises, you often want to only ensure the HA of fewer components, the object storage amongs them.

However we weren't convinced because Loki ain't implemented a real search engine such as Apache Lucene used by both Elasticsearch and SolR. It also appears to be very slow as well with bad feedbacks from the community such as this one.

So we were looking for a solution who combines the advantages of both worlds: an efficient search engine which compensates the slowness brought by the use of the object storage's API.

And yet we discovered Quickwit \o/.

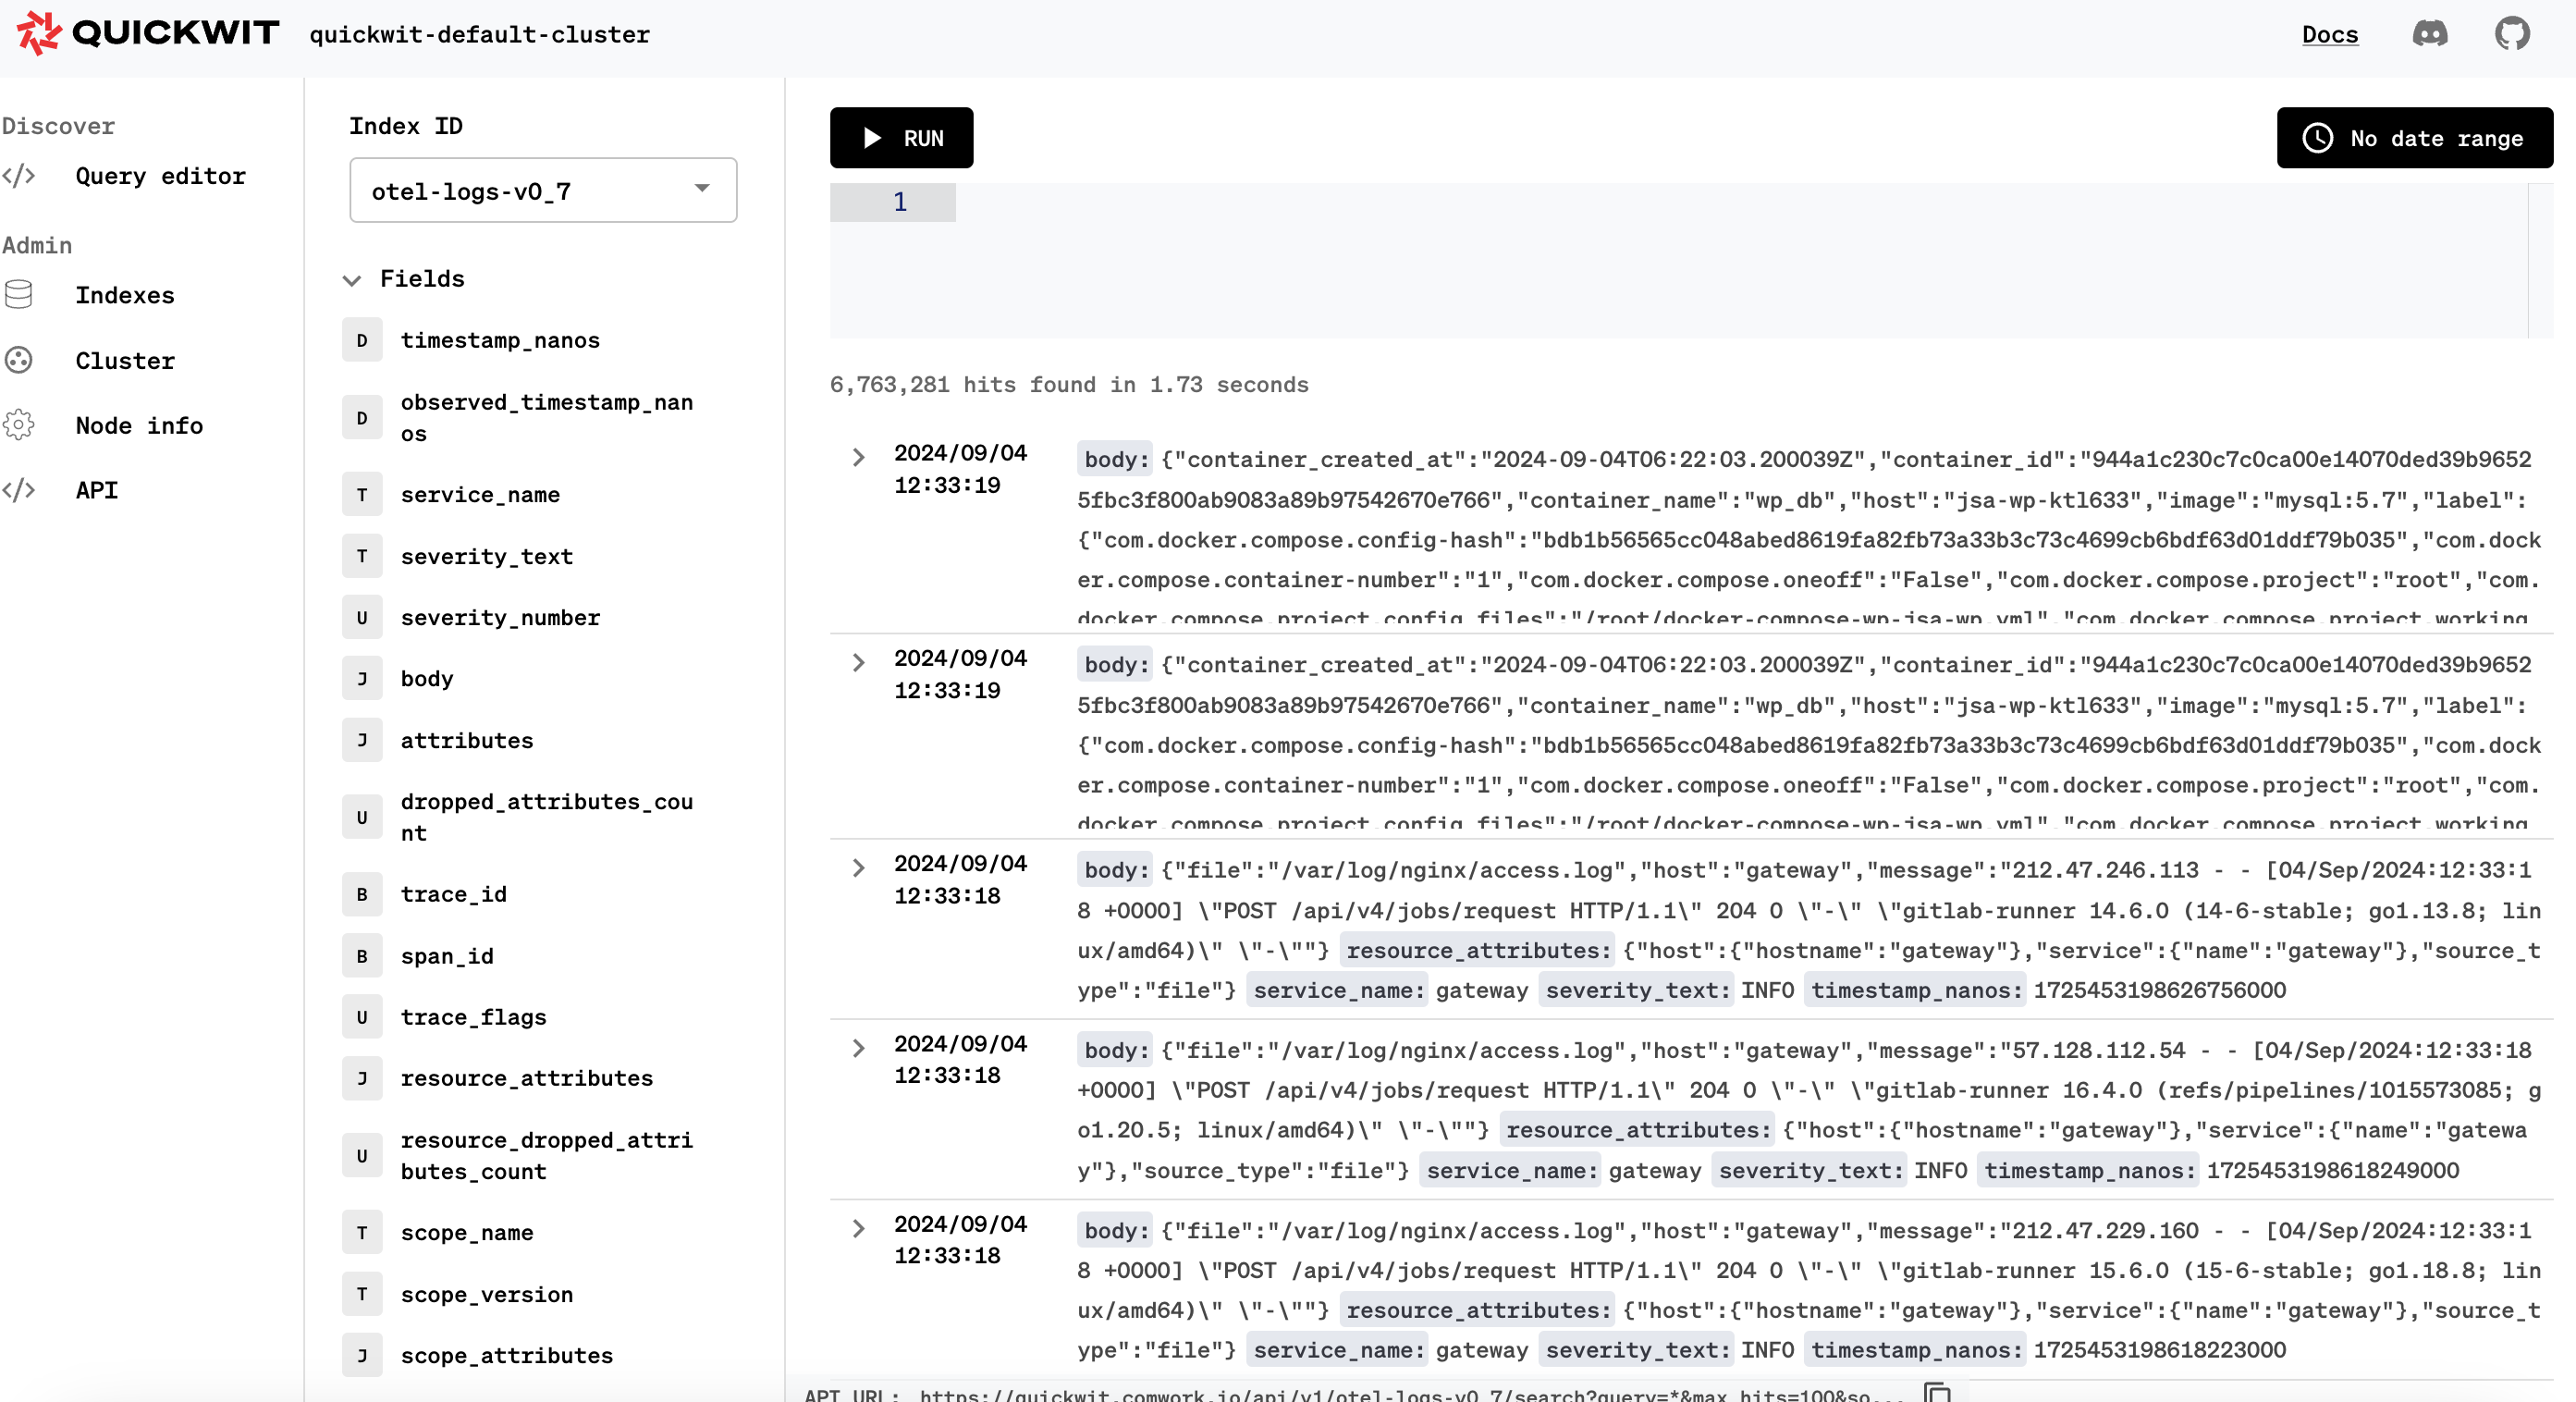
quickwit-gui

Quickwit is built on top of Tantivy which is similar to Lucene but written in Rust2, and also store the indexed data on object storage. That's the main reason making Quickwit better than Loki3 and Elasticsearch in my opinion.

Quickwit is also bringing lot's of integration with the CNCF ecosystem4:

  • A datasource for Grafana
  • OpenTelemetry interoperability for traces and logs ingestion
  • Jaeger's GRPC API interoperability which allows us to use Quickwit as a storage backend for traces and keep the Jaeger UI or Jaeger datasource on grafana. This is the only known solution to store Jaeger traces on object storage
  • Elasticsearch or Opensearch5's API interoperability
  • Falcosidekick which can use Quickwit as an output
  • Glasskube which makes easier the Quickwit's installation on Kubernetes6

quickwit-gui

That's why we decided to propose Quickwit as our main observability solution in cwcloud DaaS (Deployment as a Service) platform. You can checkout this tutorial to get more informations.

quickwit-cwcloud

Moreover, we also started to migrate most of our customers infrastructures to Quickwit instances and recommand to design their new applications with the OpenTelemetry's SDK available in their stack when it's possible or use Vector from datadog which is bringing lot of advantages as well:

  • It's very fast and has a very low footprint comparing to some other well-known solutions such as Fluentbit, Logstash and even Filebeat from ElasticStack (probably because it's written in Rust :p ).
  • It provides a very powerful VRL (Vector Remap Language) language in order to remap your logs and make-it compliants with some already existing indexes mapping7.
  • It's working with Kubernetes but also with docker and even logs written on filesystem by legacy applications. And this is very convenient for us because as explained in my previous blog post Docker in production, is it really bad?, we have lot of customer who are using docker in production (through cwcloud's DaaS) instead of Kubernetes.

For most of them as for our own internal use, we have divided the compute consumption at least by 3 while increasing the retention. Larger companies successfuly created astronomical logging service with Quickwit such as Binance with 100PB of stored data.

So now Quickwit is covering our observability needs in terms of logs and traces but we still miss the metrics. For the metrics usecase we're using VictoriaMetrics which is working pretty well but lacks the support of object storage. We know that Quickwit plans to handle this usecase one day with a real TSDB (Time Series Database) which sounds really promising. I'm quite convinced that separating the compute from the storage and propose object storage is now a success key factor for building modern observability solutions.

To conclude, I still think ElasticStack is a great product with a bigger company behind which is providing more advanced features including AI (Artificial Intelligence) capabilities. I might still offer it to some customers who might be interested by some of those features or even using Elasticsearch as a full-text search engine as a dependancy of some applications or microservices (Quickwit isn't the best choice in this case, it's more suitable for observability usecases only).


  1. We know that Elasticsearch is providing object storage compatibility with the searchable snapshot feature but it's not available in the opensource version on one hand, and only recommanded on cold data which are not supposed to be fetch too much on the other hand.
  2. Tantivy is 2x faster than Lucene according to this benchmark, this compensate the slowness brought by the use of the object storage.
  3. Quickwit also provides this benchmark with Loki, trying to make a fair comparison.
  4. I'm involved myself to contribute to lot of them, missioned by Quickwit Inc. (the company).
  5. OpenSearch is a fork of ElasticStack initiated by Amazon AWS.
  6. I wrote a blog post directly on the Quickwit's blog if you want to get more informations.
  7. You see an example of remap function in order to make the docker logs compliant with the default otel-logs-v0_7 index in this tutorial.